ccvt2Log
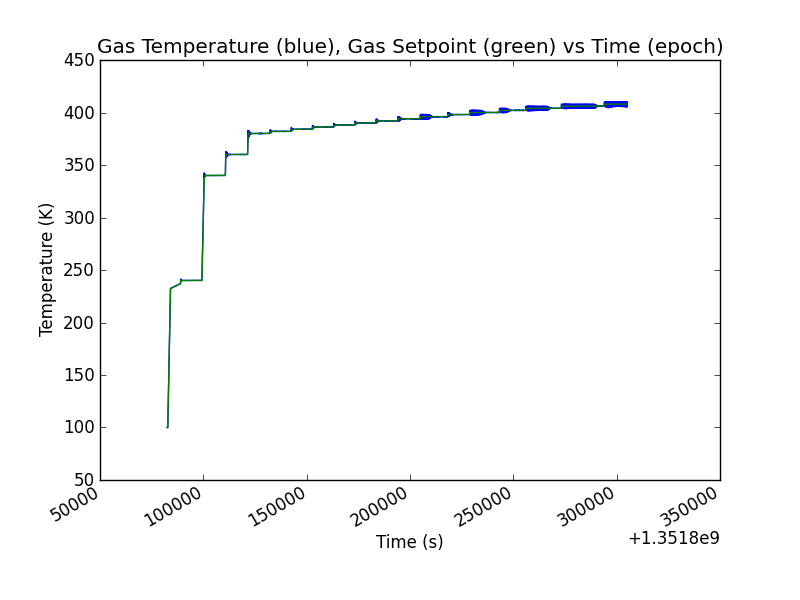
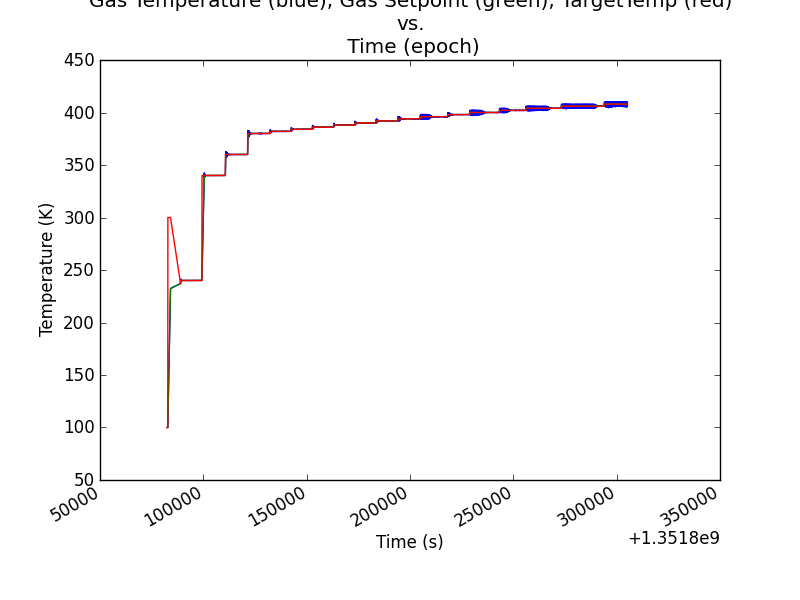
Is a simple program written in python and designed to extract the temperature information out of a CCVT run. The program parses across numerous data collections (or samples) within a specific project building up a log in chronological order and writing out two files a complex extended log of all the Cryostream parameters and a simplified log. These can be used in plotting programs such as R to generate pretty plots. The program itself generates a simple plot of all the data using pylab as well as allowing the user to highlight and save out snapshots of different regions.


